
Published
Zagreb's 218 neighbourhoods: what the city's open data shows once you join it
How we joined open data from the City of Zagreb, the statistics bureau, ZET and OpenStreetMap for all 218 neighbourhoods, and what the Grad budućnosti proposal adds.
- Open data
- Zagreb
- Data analysis
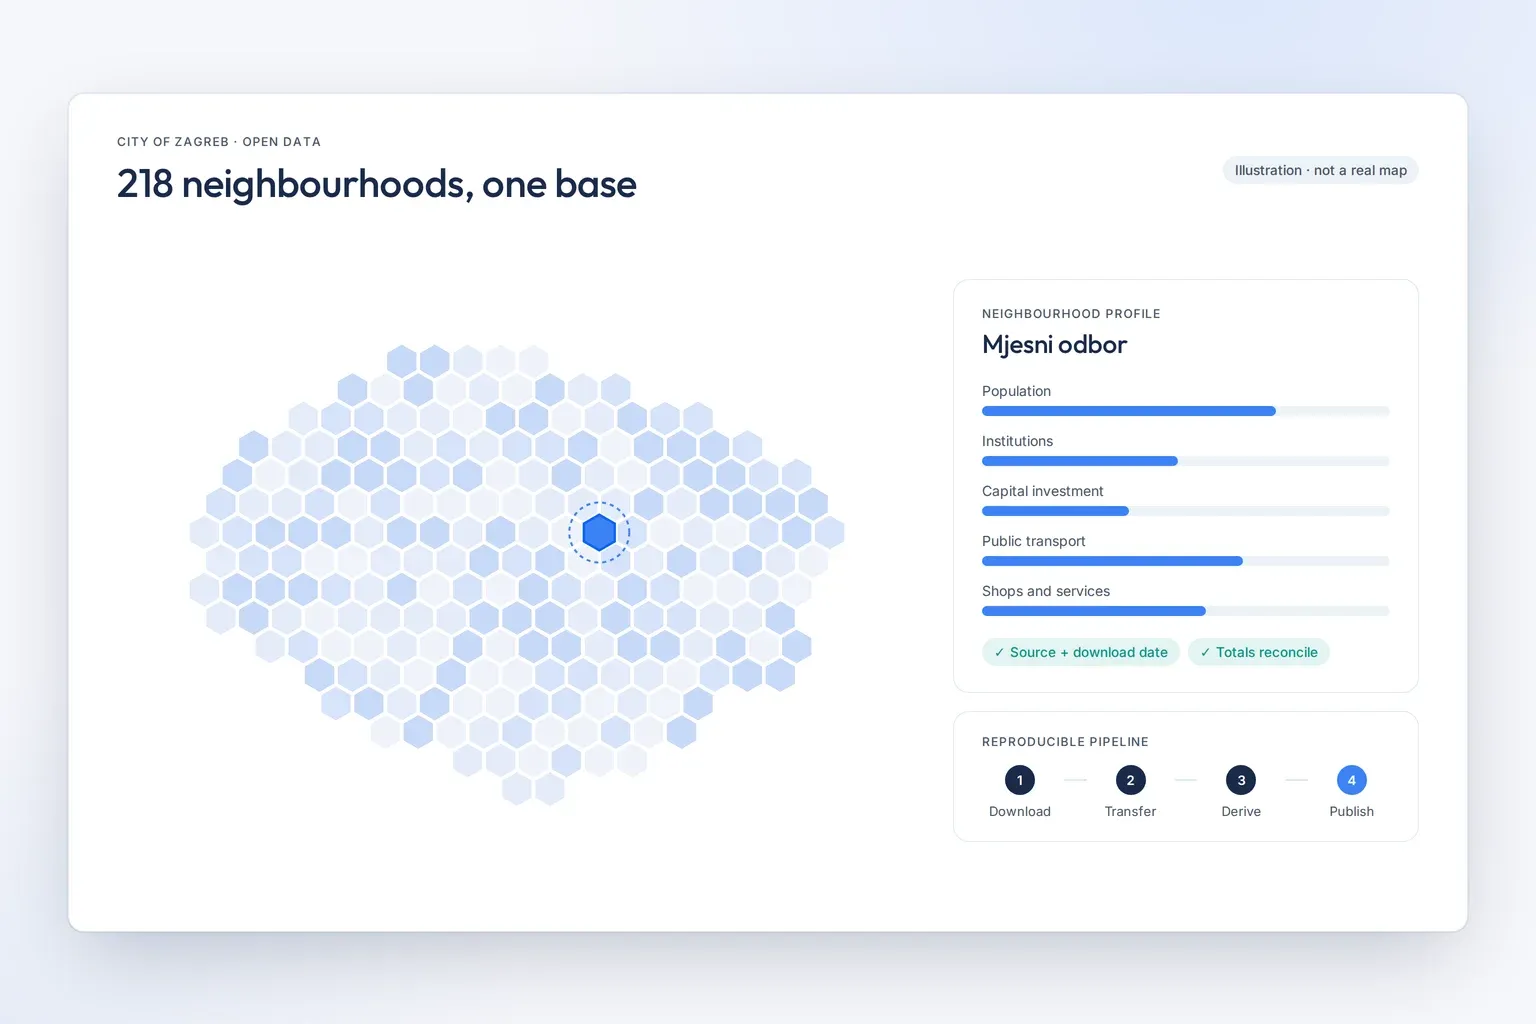
Zagreb is divided into 218 mjesni odbori — local neighbourhood committees, the smallest unit of the city’s self-government. It is the level at which residents usually think about where they live: how far the school is, how often the tram runs, where the nearest shop is. Most of the data that could answer those questions already exists and is published openly. The problem is that it is hard to join up.
So in September 2026 we ran a self-funded study that does exactly that. It joins open data only, for all 218 neighbourhoods, home to 767,131 residents in 300,329 households. The result is eight reports generated entirely by code, so they can be rebuilt from the same sources.
Why open data is hard to use today
The City of Zagreb and national institutions publish a lot of data, but each in its own frame. Boundaries, public institutions and capital investments sit on the city’s geospatial services and on the data.zagreb.hr portal. Statistical datasets are on the national portal data.gov.hr. Population, births and vital statistics come from the Croatian Bureau of Statistics (DZS), including the 2021 Census. The public transport timetable is published by ZET, Zagreb’s transit operator, as a static GTFS feed, and shops and services are best mapped in OpenStreetMap.
Each source is useful on its own. Together they do not fit: one dataset is tied to neighbourhoods, another only to the larger city districts (gradske četvrti), a third to addresses or coordinates, a fourth to stops and routes. Anyone who wants to compare two neighbourhoods first has to solve a problem that has nothing to do with them: how to bring all those frames down to one common unit.
How a reproducible pipeline fixes it
The answer is not a one-off spreadsheet assembled by hand, but a program that downloads, joins and checks the data the same way every time. The project proposal describes it in four steps:
- Download. The program fetches each source from its public server and records which release it took and when. Every published number therefore carries the source it came from and the date it was downloaded.
- Transfer. The program uses spatial joins to move onto the 218 neighbourhoods only those layers whose resolution allows it. Data published only by city district stays at district level instead of being invented at a finer one. There are two checks: every neighbourhood must receive a geometry, and totals per district must reconcile with the published district totals.
- Derive. On the joined base the program computes indicators and projections, and publishes only those that pass checks for coverage, range and direction.
- Publish. Results are computed in advance and published as ready-made files, so no request triggers a calculation on the server.
The second check is the important one. If the neighbourhood populations of a district do not add up to the number published for that district, something is wrong: the boundaries, the join or the source itself. The check does not prove everything is right, but it reliably tells you when something is not.
What the study produced
The study is self-funded and uses open data only. It covers all 218 neighbourhoods, 767,131 residents and 300,329 households, and produced eight reports in September 2026, generated by code rather than by hand. The reports are not public yet. If the project goes ahead, they will be published together with the code that produces them.
The proposal: Grad budućnosti
Building on the study, on 15 September 2026 we submitted a proposal to the City of Zagreb’s call for projects based on open data. The project is called Grad budućnosti (“City of the Future”). No decision has been made, so what follows describes a proposal, not a finished product.
The proposal plans five outputs, all publicly available, free and without registration:
- a single spatial base of all 218 neighbourhoods, with population, institutions and capital investment in one place;
- a projection of the demographic and infrastructure picture of each city district, derived from relationships tested against the census — measured quantities stay at neighbourhood level, derived ones are published at the level the source supports;
- maps, neighbourhood profile pages and two decision tools: a professional one for city bodies and a public “Gdje živjeti?” (“Where to live?”) questionnaire;
- derived datasets in machine-readable files;
- the source code that produces all of it, with a description of the method.
The licences are set in advance. Datasets are published under Creative Commons Attribution 4.0. The dataset that includes a layer taken from OpenStreetMap (via Geofabrik’s Croatia extract) is published under the Open Database License 1.0, because that licence requires a derived database to carry the same licence. The code is published under the MIT licence.
No personal data, no inputs of our own
The project works only with aggregate data that has already been published. No result describes an individual, a household or a single address, and the smallest unit shown is the neighbourhood. No source requires a contract, a fee or an access key.
Every quantity is derived from data that is already public; the project adds no input of its own. A derived quantity is new, but its sources are not, so anyone can check it. Only relationships that survive testing are published, and the list of what was tested and rejected is published alongside the results, with the reason for each rejection.
What it shows about open data quality
The most useful by-product of a pipeline like this is not the map but the measurement. Every source that fails a check, every layer that cannot be moved onto neighbourhoods and every total that does not match the published one points to a specific place where open data is not yet as usable as it could be. Alongside a description of its neighbourhoods, the city would get measurable feedback on its own data.
Because the code and the source log are open, anyone — the city, another applicant or a resident — can repeat and refresh the process on new releases of the data, with no obligation to us.
If you work with Zagreb’s open data or need data analysis for your own area, get in touch.
Source links checked on 27 September 2026. Grad budućnosti is a proposal submitted to a public call; no decision has been made on it yet.